Visualization Tools
Visualization Tools let you view and interact with our data. You can choose
one or more sensors by location, then see what data those sensors have collected
as a function of time.
Choose one of the links below to see our data.
"Grazor"
is the easiest way to get
data collected by the life under your feet sensor networks.
Grazor was designed to make data selections and visualization
simple and intuitive. Our new visualization tool
allows the user to navigate through
the data collected by the life under your feet deployments.
The main features of Grazor are:
-
Locate our deployment sites using a map control
-
Select multiple locations and sensor types to explore
the spatio-temporal correlations in the data
-
Download the selected data in CSV format.
|
|
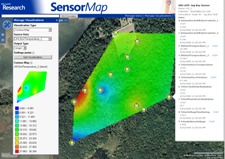
Microsoft SenseWeb
portal allows one to visualize our data
using the senseweb portal. Our data is published in a
format that is understood by the senseweb portal and
we can take advantage of the following attractive visualization features
of Senseweb:
-
Heat map movies to
visualize data in time and space overlaid on
satellite images.
-
Correlate Time-series plots across motes and
sensing variables
|
|
Help is provided for those who would
like to understand more about these tools, using SQL, and the
properties of the objects stored in our database.
|