Data
|
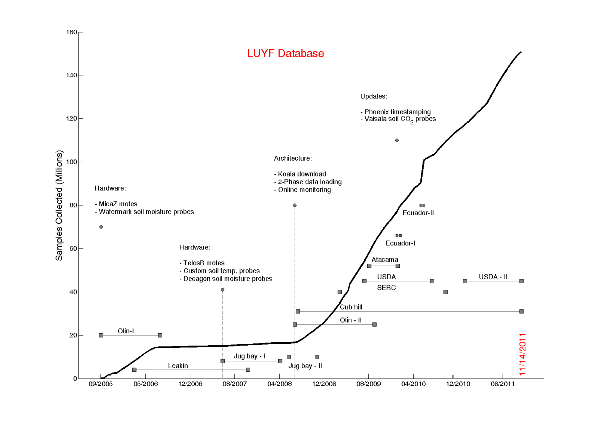
The amount of data collected by the Life Under Your Feet deployments
(click to see high resolution image). |
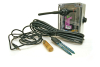
Our sensor network measures the following data (note: not all nodes measure each variable):
| - Surface Temperature |
- Soil Temperature |
| - Soil Water Pressure |
- Volumetric Soil Water Content |
| - Light Flux |
- CO2 Flux |
| - Surface Moisture |
- Battery Voltage |
| - Photo-Active Radiation |
- Total Solar Radiation |
Visualization Tools
Grazor
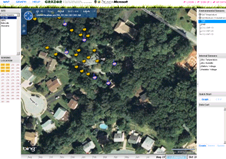
The easiest way to get to the data collected by the life under your feet sensor networks is using "Grazor" .
Grazor was designed to make data selections and visualization simple and intuitive. Our new visualization tool
allows the user to navigate through the data collected by the life under your feet deployments.
The main features of Grazor are:
- Locate our deployment sites using a map control
- Select multiple locations and sensor types to explore the spatio-temporal correlations in the data
- Download the selected data in CSV format.
|
|
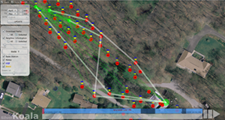
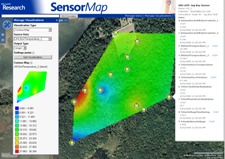
SilverKoala
SilverKoala allows you
to view the paths chosen by motes to transmit their data during a data download cycle. SilverKoala
helps us understand the performance and behavior of the ultra-low-power download protocol,
koala, in a visual way (see our
abstract
or paper
for more information about koala). SilverKoala is able to:
- Show the download path of each mote during an specific period of time, overlaid
on high-resolution images
- Show connectivity information for each mote using the received signal strength
indicator (RSSI) and Link Quality Indicator (LQI) metrics
- Create a movie of the download paths and neighborhood information
|
|
Sense Web
Microsoft SenseWeb portal allows one to visualize our data using the senseweb portal. Our data is published in a
format that is understood by the senseweb portal and we can take advantage of the following attractive visualization features
of Senseweb. Data from our Jug Bay deployment is available using SenseWeb:
- Heat map movies to visualize data in time and space overlaid on satellite images.
- Correlate Time-series plots across motes and sensing variables
|
|
|