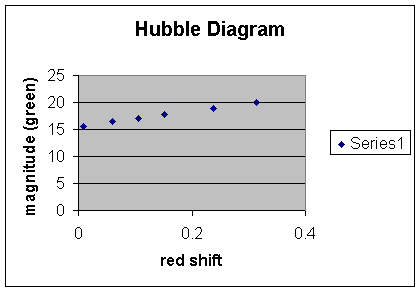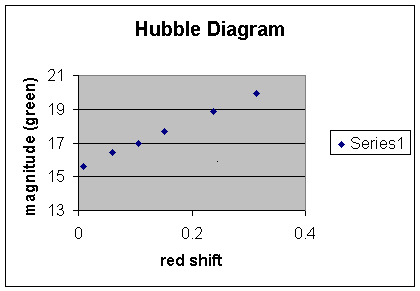
Changing the Scale of a GraphChanging the scale of a graph allows you to zoom in on the graph's features. Let's use the Hubble Diagram graph from the previous page as an example.
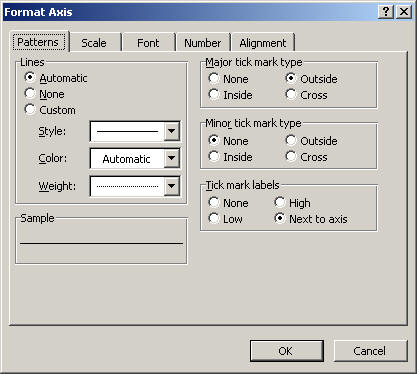
You can zoom in on the graph by resetting the scale on the y-axis. Double-click on the y-axis and a Format Axis box will appear as shown below:
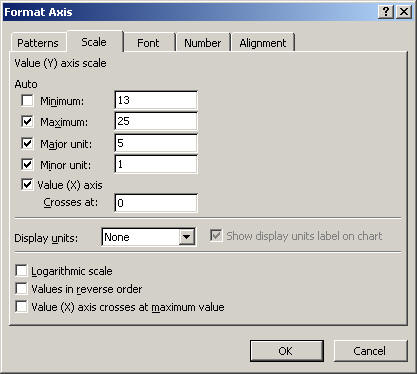
Click on the scale button. Try changing the y-axis scale to range from 13 to 25.
Click OK, and your modified graph will appear.
Double-clicking on the x-axis will allow you to modify the x-axis in a similar manner.
|

 |