Creating a GraphOnce you have selected the data you wish to graph, click the Chart Wizard:
The first step in making a graph is to select the Chart type. In this tutorial, we will make an x-y scatter plot.
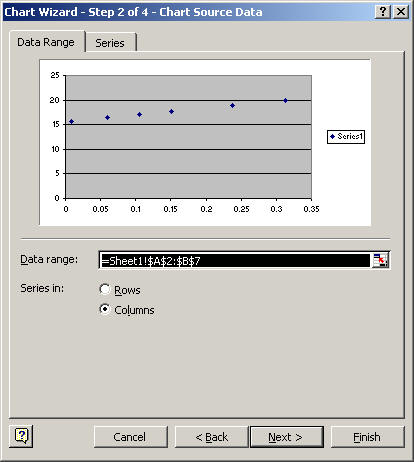
Click Next to get a preview of your graph. If the graph looks very different from what you expected, you may have selected your data incorrectly.
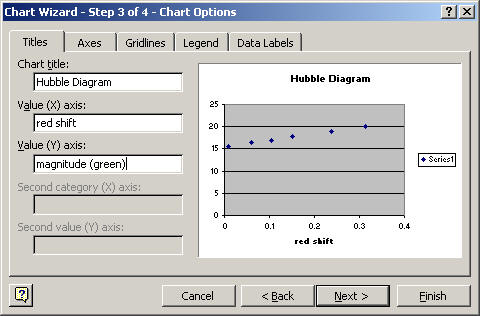
The next step is to label your graph and axes.
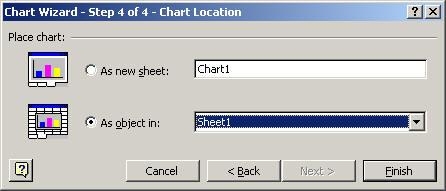
The last step is to select whether you wish to open the chart as a new sheet or as an object in your existing sheet. Choose whatever option you prefer.
Click Finish and you will see your graph!
|

 |
 . Alternatively, select Chart from
the Insert menu.
. Alternatively, select Chart from
the Insert menu.